Master technical analysis techniques for commodity trading, including chart patterns, indicators, and trading strategies
Understanding Market Psychology and Price Action
Technical Analysis is the study of market action, primarily through the use of charts, for the purpose of forecasting future price trends. This comprehensive course covers essential techniques used by professional traders worldwide.
Technical analysis helps traders identify trading opportunities by analyzing statistical trends gathered from trading activity, such as price movement and volume.
Chart patterns are the foundation of technical analysis. Learning to recognize and interpret these patterns is crucial for identifying potential trading opportunities and market reversals.
Pattern recognition requires practice and experience. Always confirm patterns with other technical indicators and proper risk management.
Master Pattern Recognition for Trading Success
Advanced Tools for Market Analysis
Technical indicators are mathematical calculations based on historical price, volume, or open interest information that help traders make informed decisions about market direction and potential trading opportunities.
Combine multiple indicators for confirmation. No single indicator should be used in isolation - always use a comprehensive approach with proper risk management.
Technical analysis fundamentals provide the foundation for understanding how markets move and how prices behave over time.
This includes the study of price charts, timeframes, and chart types such as line charts, bar charts, and candlestick charts. Core principles like "price discounts everything," "prices move in trends," and "history tends to repeat itself" form the basis of technical analysis. These fundamentals help traders interpret market data objectively and avoid emotional decision-making.
A strong conceptual foundation for reading and interpreting market charts with confidence and precision.
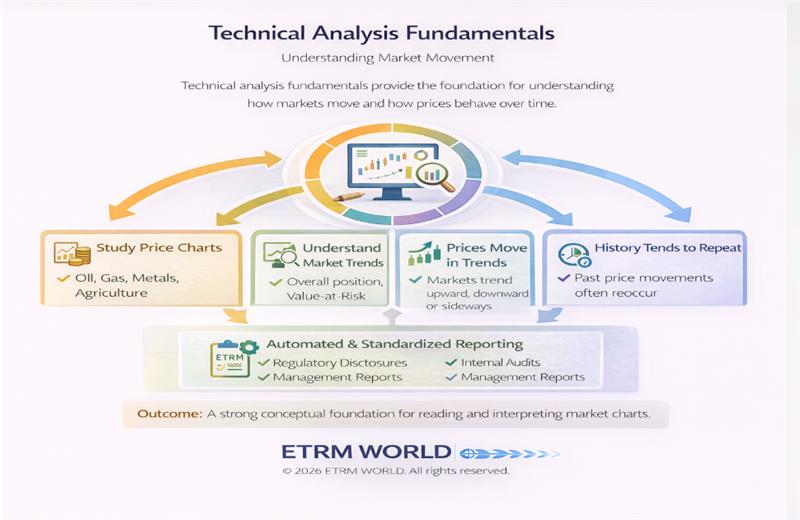
Technical Analysis Fundamentals
Simple price connection over time periods
OHLC visualization details
Detailed price action patterns
Multiple period analysis
© 2026 ETRM World Powerd By 3DGLOBAL. All rights reserved.
Market psychology explains how collective human behaviour influences price movements in financial markets.
Emotions such as fear, greed, optimism, and panic play a significant role in shaping market trends and reversals. Technical analysis captures these psychological factors through recurring patterns and indicators. Understanding market psychology helps traders recognize crowd behaviour, avoid common emotional traps, and align trading decisions with prevailing market sentiment.
Markets are driven by human emotions and cognitive biases. Recognizing these patterns gives traders a significant edge in anticipating price movements.

Market Psychology Principles
Fear gauge measurement
Options sentiment
Market sentiment poll
Participation levels
© 2026 ETRM World Powerd By 3DGLOBAL. All rights reserved.
Price action analysis focuses on studying raw price movements without relying heavily on technical indicators.
By observing how prices move, consolidate, break out, or reverse, traders gain insights into supply and demand dynamics. Candlestick patterns, price ranges, and breakout formations are commonly used to identify entry and exit points. Price action analysis emphasizes simplicity and clarity in decision-making.
Improved ability to read market behaviour directly from price charts with confidence and precision.
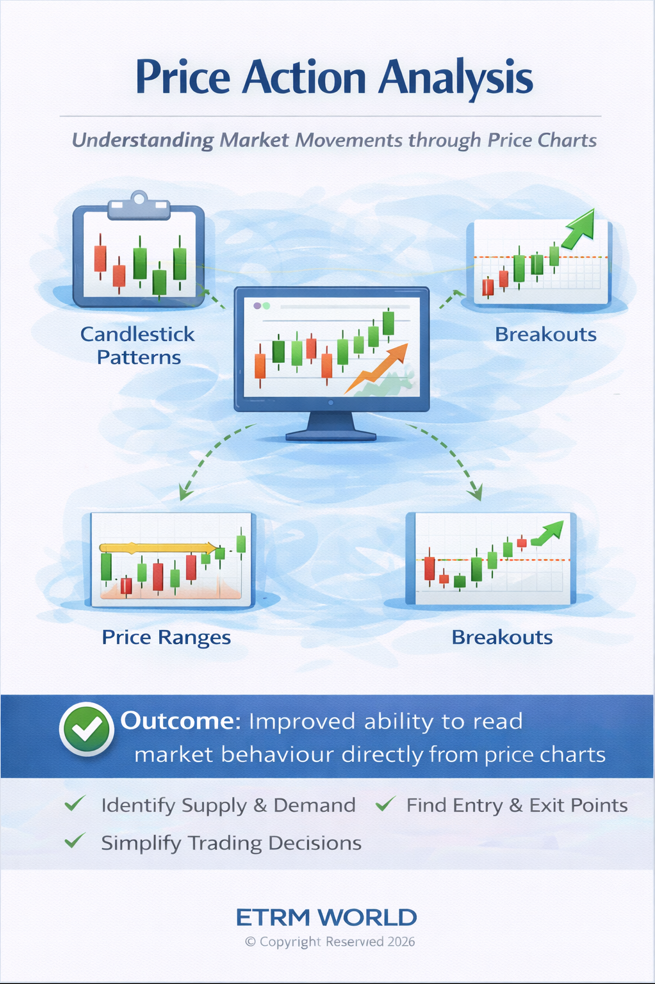
Price Action Analysis
Directional price changes and momentum
Price range formation and accumulation
Price breaking through key levels
Trend change and pattern shifts
© 2026 ETRM World Powerd By 3DGLOBAL. All rights reserved.
Support and resistance levels represent key price areas where buying or selling pressure tends to increase significantly.
Support levels indicate zones where prices often stop falling due to increased demand, while resistance levels mark areas where prices struggle to rise due to selling pressure. These levels are critical for identifying potential reversals, breakouts, and price targets. Traders use support and resistance to plan entries, exits, and stop-loss levels with precision.
Clear identification of important price zones for strategic trade planning and risk management.
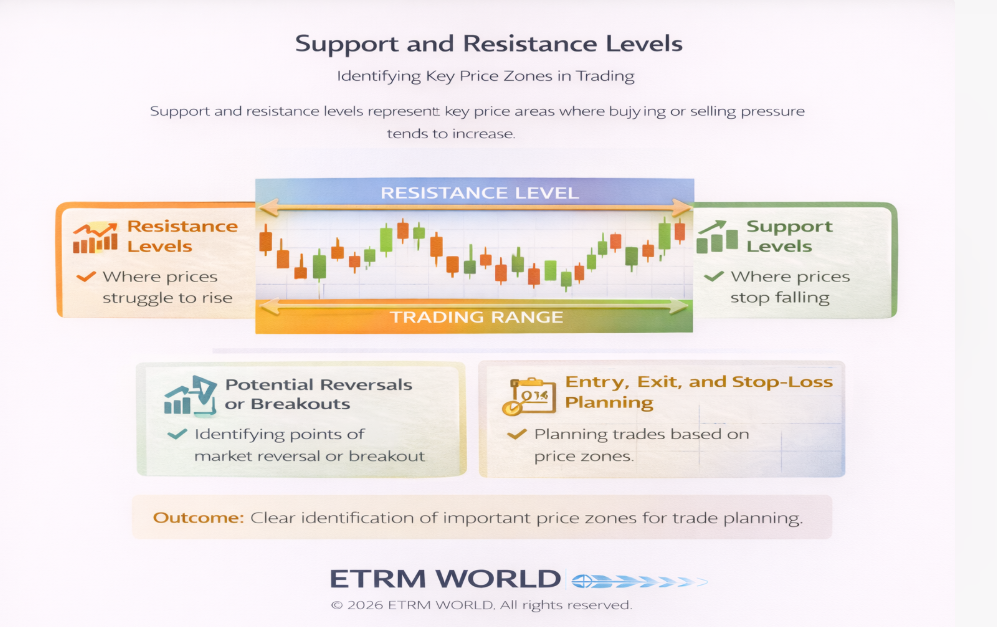
Support and Resistance Levels
Price zones with increased buying demand
Price zones with increased selling pressure
Trend change identification points
Price breaking through key zones
© 2026 ETRM World Powerd By 3DGLOBAL. All rights reserved.
Trend analysis helps traders determine the overall direction and momentum of the market.
Trends can be upward, downward, or sideways, and identifying them correctly is essential for aligning trades with market momentum. Techniques such as trendlines, moving averages, and higher-high/lower-low analysis are used to confirm trends. Trading in the direction of the trend generally increases the probability of success and improves risk-reward ratios.
Ability to identify and trade in alignment with market trends for improved success probability.
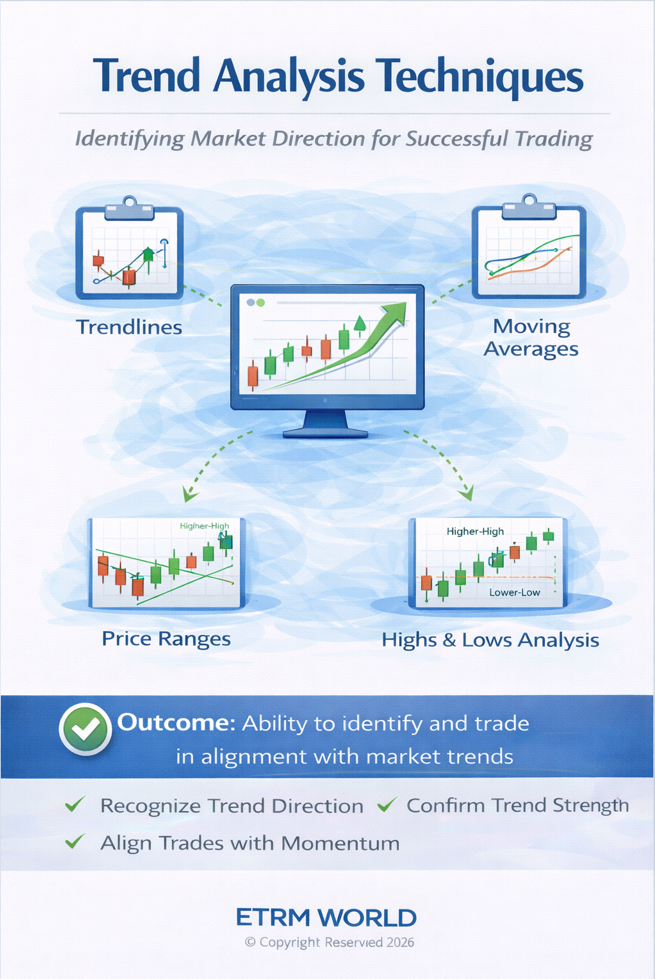
Trend Analysis Techniques
Higher highs and higher lows pattern
Lower highs and lower lows pattern
Price range bound movement
Strength and persistence of trend
© 2026 ETRM World Powerd By 3DGLOBAL. All rights reserved.
Volume analysis examines the strength and sustainability of price movements in financial markets.
Trading volume reflects market participation and conviction behind price changes. Rising prices supported by high volume often indicate strong trends, while low volume may signal weak or false moves. Volume analysis helps validate breakouts, confirm trends, and detect potential reversals before they occur.
Enhanced confidence in price signals through volume confirmation and improved trading decision quality.
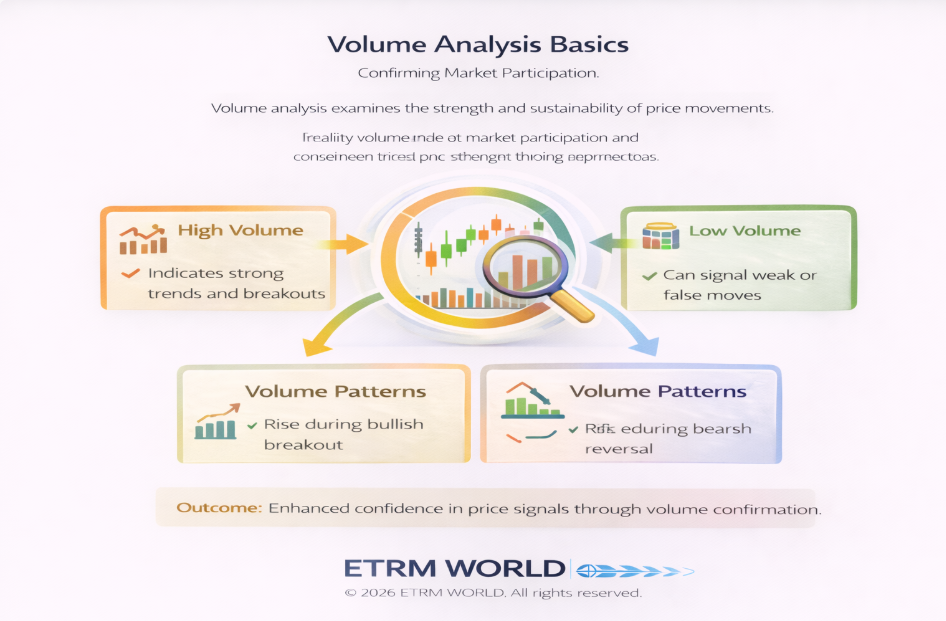
Volume Analysis Basics
Level of trader involvement
Strength behind price changes
Confirming price movements
Early warning signals
© 2026 ETRM World Powerd By 3DGLOBAL. All rights reserved.
Reversal patterns indicate a potential change in the prevailing market trend, signalling that the existing trend may be losing strength and momentum.
The Head and Shoulders pattern is among the most reliable and widely recognized reversal formations. It typically forms after a sustained uptrend and reflects a gradual shift from buyer dominance to seller control. The pattern consists of three distinct peaks that provide clear trading signals.
The neckline acts as a critical support level connecting the lows between the peaks. A confirmed break below the neckline signals trend reversal. The Inverse Head and Shoulders, formed after a downtrend, signals a bullish reversal and follows the same logic in reverse.
Early and reliable identification of major trend reversals with clear entry and exit points.
.png)
Reversal Patterns (Head & Shoulders)
Bearish reversal after uptrend
Bullish reversal after downtrend
Critical support/resistance level
Buyer to seller dominance change
© 2026 ETRM World Powerd By 3DGLOBAL. All rights reserved.
Continuation patterns suggest that the market is temporarily consolidating before resuming the prevailing trend with renewed momentum.
Triangle patterns form when price action becomes progressively narrower, reflecting balance and indecision between buyers and sellers. These patterns typically indicate a pause in the trend rather than a reversal, offering high-probability trading opportunities when the breakout occurs.
Volume typically contracts during triangle formation and expands sharply during breakout. Traders wait for confirmation before entering positions in the direction of the breakout, which often leads to significant price moves.
High-probability breakout trading aligned with the dominant market trend and proper risk management.
.png)
Continuation Patterns (Triangles)
Bullish continuation pattern
Bearish continuation pattern
Neutral consolidation pattern
Contracting during formation
© 2026 ETRM World Powerd By 3DGLOBAL. All rights reserved.
Candlestick patterns offer granular insight into short-term market sentiment and price behaviour through visual price action analysis.
Each candlestick reflects four key data points—open, high, low, and close—allowing traders to interpret intraday or inter-period buying and selling pressure. These patterns provide early warning signals and confirmation of market moves when analyzed in proper context.
Candlestick patterns are most effective when analysed in context—near support and resistance levels, trendlines, or chart patterns. They provide valuable timing information for trade entries and exits.
Improved trade timing and confirmation of market signals through precise candlestick analysis.
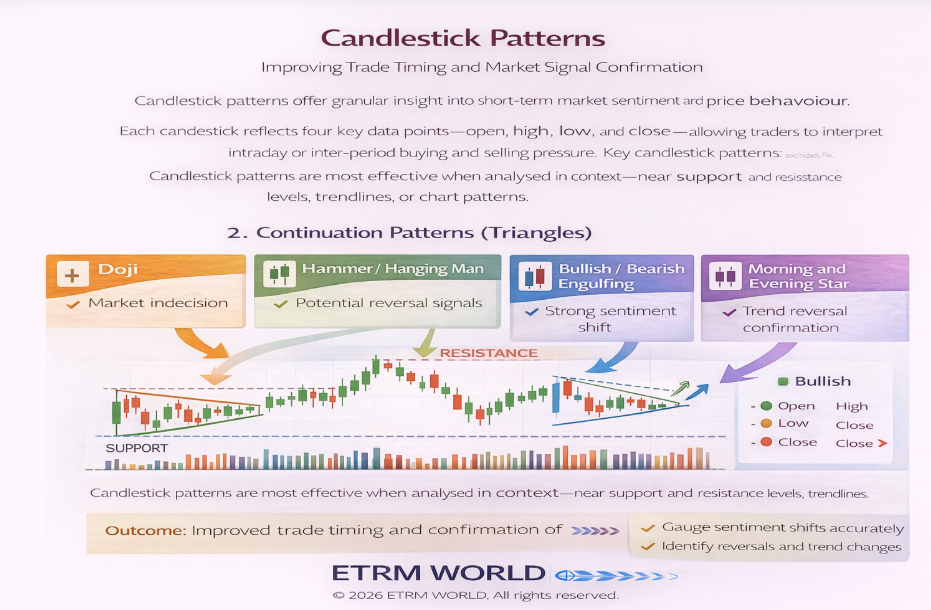
Candlestick Patterns
Market indecision signal
Potential reversal signals
Strong bullish sentiment shift
Strong bearish sentiment shift
© 2026 ETRM World Powerd By 3DGLOBAL. All rights reserved.
Double Top and Double Bottom patterns represent price rejection at key levels, signaling trend exhaustion and potential reversal points with high reliability.
A Double Top forms after an uptrend when price fails twice to break above a resistance level, indicating diminishing buying strength. A break below the intervening support confirms a bearish reversal with clear entry and exit points.
A Double Bottom forms after a downtrend when price fails twice to break below a support level, indicating selling pressure is weakening. A break above resistance confirms a bullish reversal with defined risk parameters.
Clear identification of market turning points with high-confidence reversal signals and proper risk management.
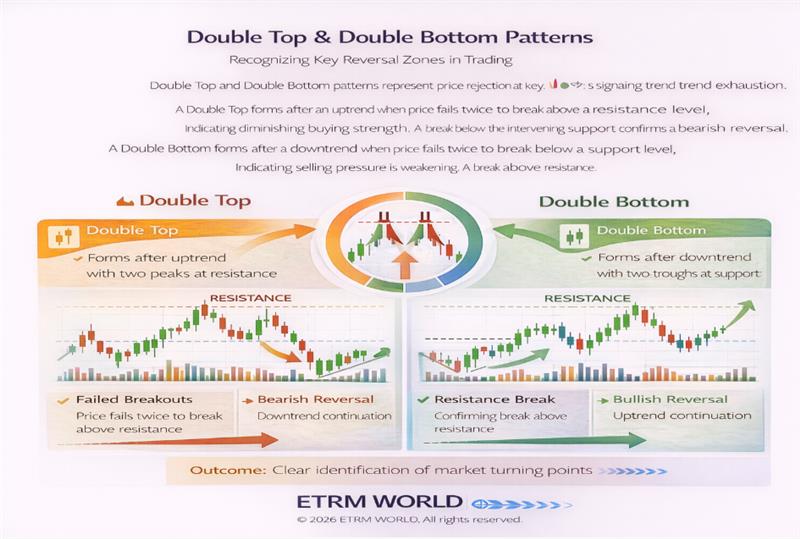
Double Top & Bottom Patterns
Bearish reversal after uptrend
Bullish reversal after downtrend
Failed attempts at key levels
Signaling trend reversal points
© 2026 ETRM World Powerd By 3DGLOBAL. All rights reserved.
Flag and Pennant patterns are short-term continuation patterns that occur after sharp price movements, offering high-probability trading opportunities during strong trends.
Flags: Rectangular consolidation zones sloping against the prevailing trend, representing brief pauses in momentum
Pennants: Small symmetrical triangles formed after strong momentum moves, indicating temporary consolidation before trend continuation
These patterns represent brief pauses where the market consolidates before continuing in the direction of the original move. Volume typically declines during consolidation and increases sharply during breakout, providing confirmation signals for trade entries.
Identification of low-risk continuation trades during strong trends with favorable risk-reward ratios.
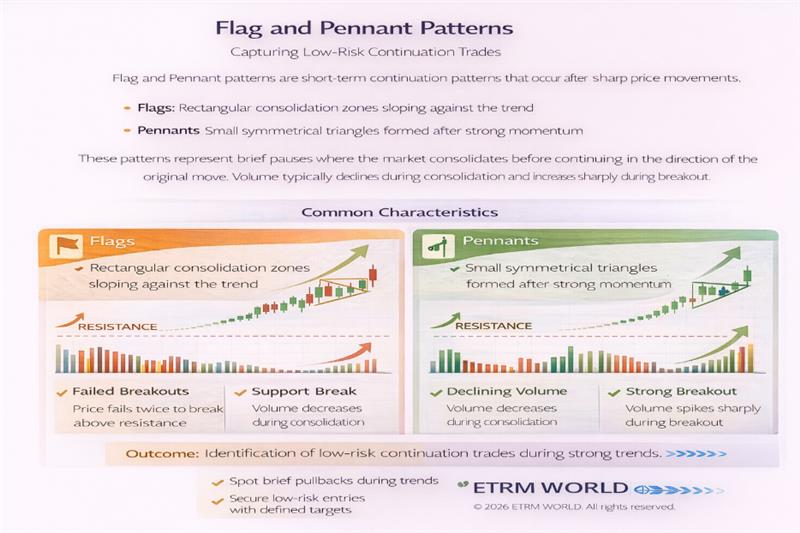
Flag and Pennant Patterns
Rectangular consolidation zones
Small symmetrical triangles
Market consolidation periods
Declines during consolidation
© 2026 ETRM World Powerd By 3DGLOBAL. All rights reserved.
Wedge and Channel patterns help traders understand trend structure and directional bias, providing valuable insights for strategic trade planning.
Wedges: Formed by converging trendlines that indicate potential reversals or continuation patterns depending on the context and breakout direction.
Rising wedges often signal bearish reversals as buying momentum weakens, while falling wedges often signal bullish reversals as selling pressure diminishes.
Channels: Formed by parallel trendlines indicating orderly price movement within defined boundaries, offering systematic trading opportunities.
Traders buy near channel support and sell near channel resistance for consistent profits. Breakouts from channels may signal trend acceleration or reversal, providing additional trading opportunities.
Enhanced trend interpretation and structured trade planning with defined risk parameters and profit targets.
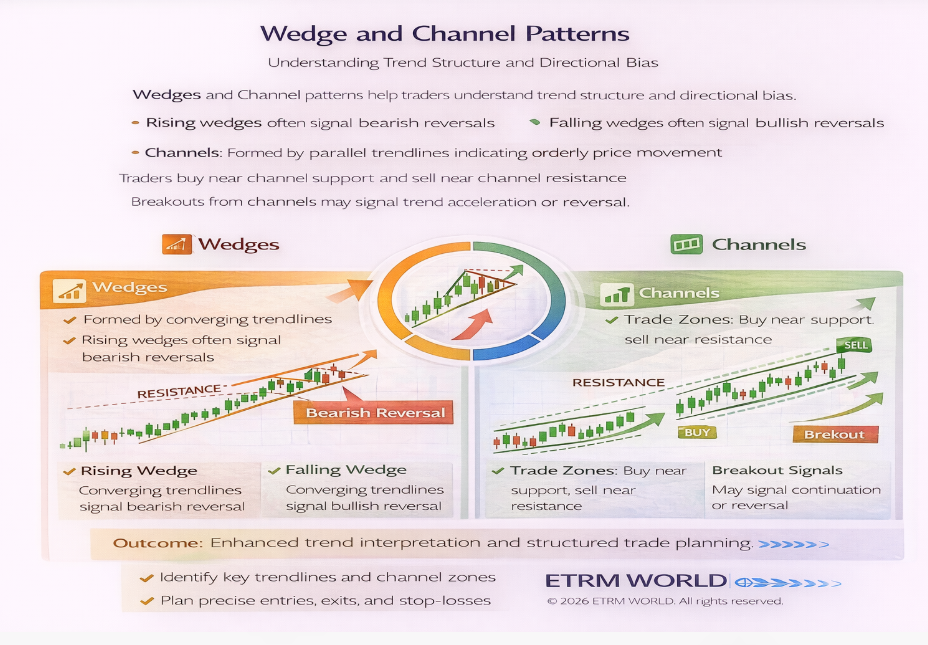
Wedge and Channel Patterns
Bearish reversal signal
Bullish reversal signal
Parallel trendlines
Structured price action
© 2026 ETRM World Powerd By 3DGLOBAL. All rights reserved.
Technical Indicators are mathematical calculations applied to price, volume, or open interest data to help traders analyse market behaviour. These tools assist in identifying trend direction, momentum strength, volatility conditions, and potential reversal points.
Indicators do not predict markets on their own, but when used correctly, they provide objective confirmation for trading decisions. Technical indicators are widely used across equity, commodity, forex, and derivatives markets and are most effective when combined with price action and chart patterns.
Moving averages smooth out price data to help identify the overall trend direction and reduce market noise.
Simple Moving Average (SMA): Calculates the average price over a fixed number of periods, giving equal weight to each data point. It is commonly used to identify long-term trends and provides stable signals.
Exponential Moving Average (EMA): Assigns greater weight to recent prices, making it more responsive to price changes and suitable for short-term analysis with faster signal generation.
Moving averages are used for trend identification, dynamic support and resistance, and crossover strategies such as the Golden Cross and Death Cross for systematic trading approaches.
Clear identification of market trends and trend strength with reliable signal generation for trading decisions.
.png)
Moving Averages (SMA, EMA)
Simple Moving Average
Exponential Moving Average
SMA gives equal weight to all data points
EMA focuses on recent price changes
© 2026 ETRM World Powerd By 3DGLOBAL. All rights reserved.
Oscillators measure momentum and help identify overbought and oversold conditions, providing valuable insights for timing trade entries and exits.
RSI ranges from 0 to 100 and measures the speed and change of price movements. Readings above 70 indicate overbought conditions, while readings below 30 suggest oversold conditions.
Compares the closing price to a price range over a specific period, helping detect momentum shifts earlier than RSI with more sensitive signals.
These indicators are particularly useful in range-bound or sideways markets and help traders anticipate potential reversals by identifying extreme momentum conditions that often precede price corrections.
Better timing of entries and exits during momentum shifts with early reversal signal detection.
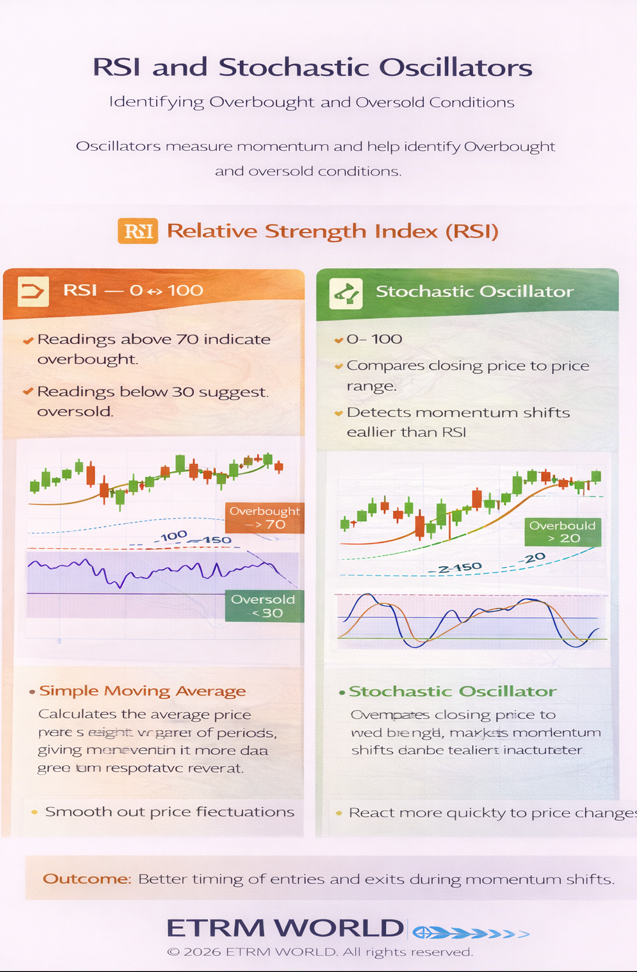
RSI and Stochastic Oscillators
0 to 100 scale
0 to 100 scale
Above 70 (RSI) / 80 (Stochastic)
Below 30 (RSI) / 20 (Stochastic)
© 2026 ETRM World Powerd By 3DGLOBAL. All rights reserved.
MACD and momentum indicators help identify trend direction, strength, and potential trend reversals, providing comprehensive market analysis tools for traders.
Consists of the MACD line, signal line, and histogram. Crossovers, divergence, and histogram expansion or contraction provide reliable trade signals for trend analysis.
Measure the rate of price change and help confirm whether a trend is accelerating or weakening, providing momentum-based trading signals.
MACD is particularly effective in trending markets and provides both trend-following and momentum-based signals, making it one of the most versatile technical indicators available for systematic trading approaches.
Improved confirmation of trend continuation or reversal with reliable signal generation and momentum analysis.
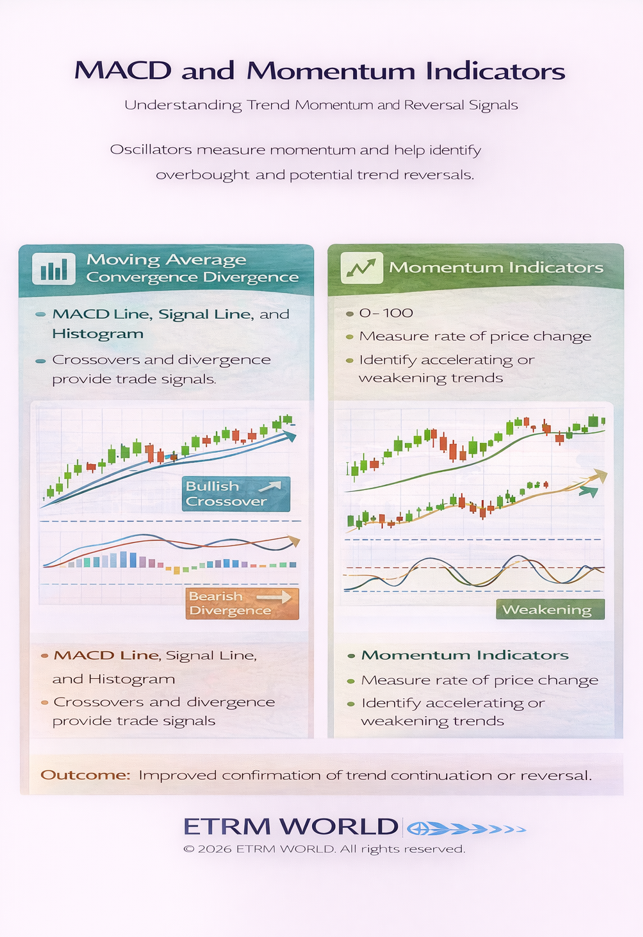
MACD and Momentum Indicators
Main trend indicator
Trigger for signals
Momentum visualization
Trade signal generation
© 2026 ETRM World Powerd By 3DGLOBAL. All rights reserved.
Bollinger Bands measure market volatility and price deviation from the mean, providing valuable insights for trading decisions based on statistical analysis of price movements.
The indicator consists of a middle moving average and two outer bands representing standard deviations. When volatility increases, the bands widen, when volatility decreases, the bands contract.
Traders use Bollinger Bands to identify volatility breakouts, overbought/oversold conditions, and price reversals near the bands. The "Bollinger Squeeze" often signals upcoming sharp price movements, providing early warning signals for potential breakouts.
Enhanced understanding of volatility and price extremes with systematic trading approaches based on statistical analysis.
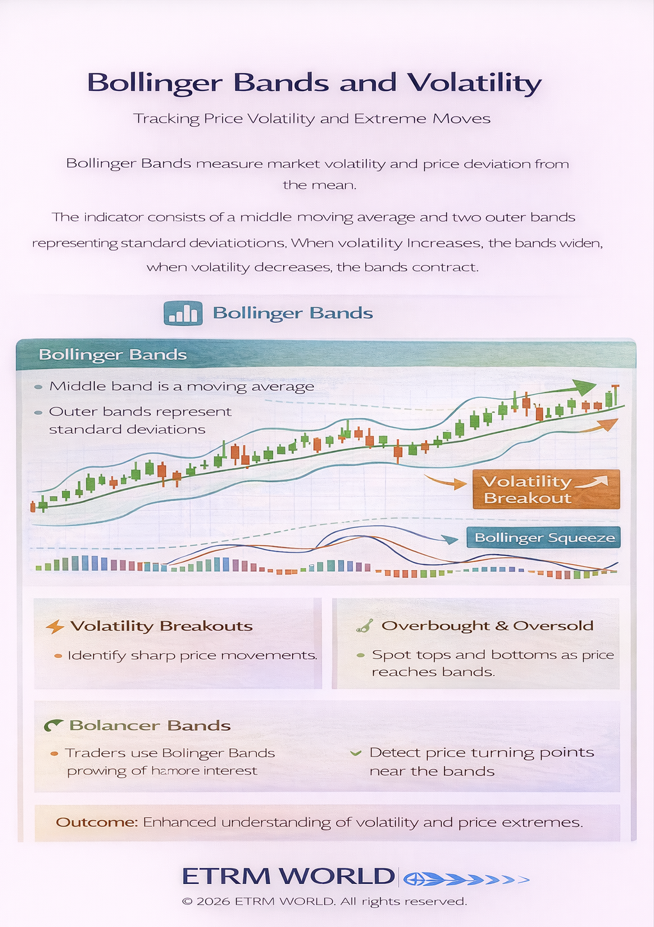
Bollinger Bands and Volatility
Simple Moving Average
SMA + Standard Deviation
SMA - Standard Deviation
Volatility measurement
© 2026 ETRM World Powerd By 3DGLOBAL. All rights reserved.
Fibonacci retracement levels are used to identify potential support and resistance zones during price corrections, providing mathematical precision to technical analysis.
Common retracement levels include 23.6%, 38.2%, 50%, and 61.8%. These levels are derived from the Fibonacci sequence and reflect natural market behaviour driven by collective psychology.
Traders use Fibonacci levels to plan pullback entries, profit targets, and stop-loss placement within trending markets, creating systematic trading approaches based on mathematical ratios that have proven reliable across various market conditions.
Precise identification of high-probability retracement zones with systematic entry and exit planning.
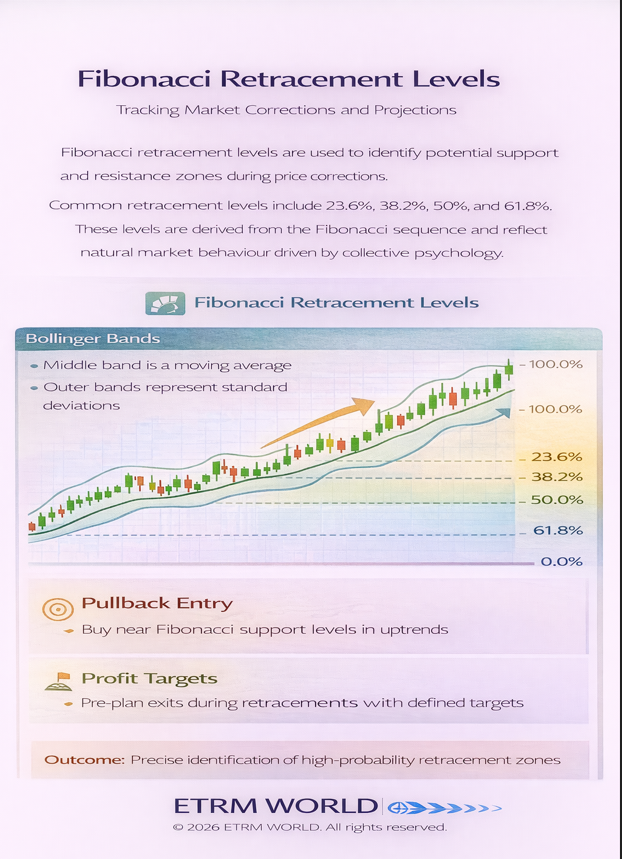
Fibonacci Retracement Levels
Shallow retracement level
Common pullback level
Mid-point retracement
Golden ratio retracement
© 2026 ETRM World Powerd By 3DGLOBAL. All rights reserved.
Volume indicators analyse the strength behind price movements, providing crucial confirmation signals that validate price action and market sentiment.
Volume indicates the level of market participation. Rising prices with increasing volume suggest strong trends, while declining volume may signal weakening momentum and potential reversals.
On-Balance Volume cumulatively adds or subtracts volume based on price direction, helping identify accumulation or distribution phases by tracking institutional money flow.
Volume analysis is crucial for confirming breakouts, trends, and reversals, as volume precedes price and provides early warning signals of potential market direction changes, making it an essential component of comprehensive technical analysis.
Stronger validation of price movements through volume confirmation and improved signal reliability.
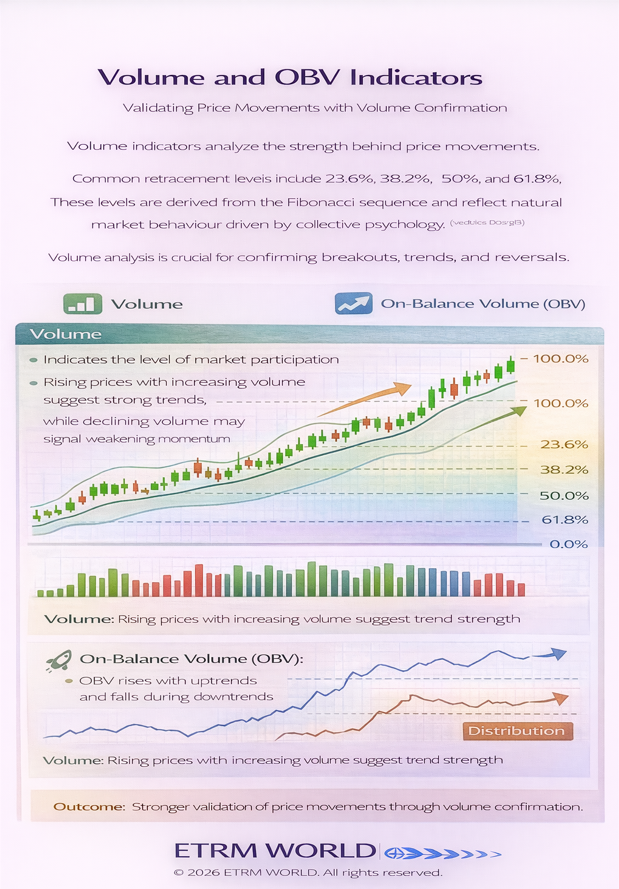
Volume and OBV Indicators
Level of trader involvement
Volume confirms price direction
Institutional buying phase
Institutional selling phase
© 2026 ETRM World Powerd By 3DGLOBAL. All rights reserved.